3.5 Stability Circles
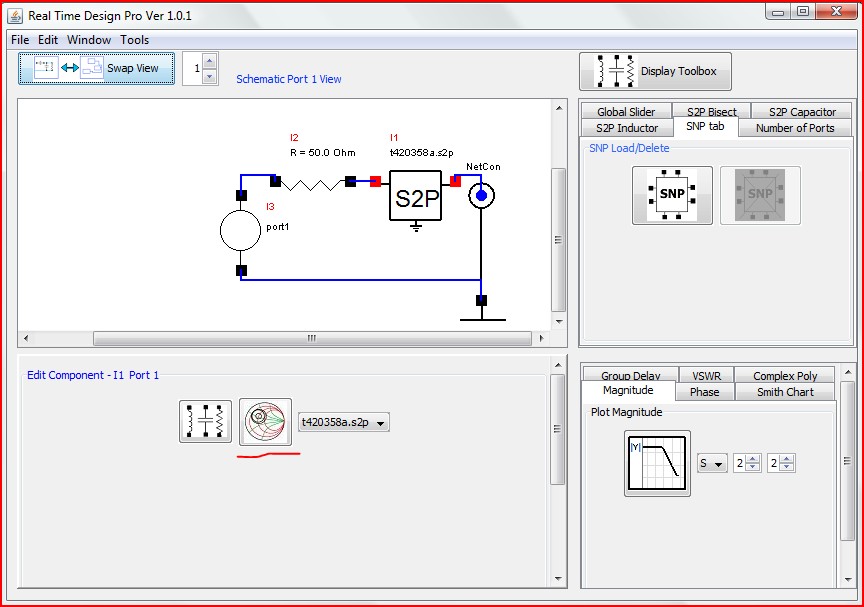
As touched upon in section 3.4 loading the S2p port that contains non passive data will invoke the Smith Chart icon which is highlighted in the Edit component region of the main window.
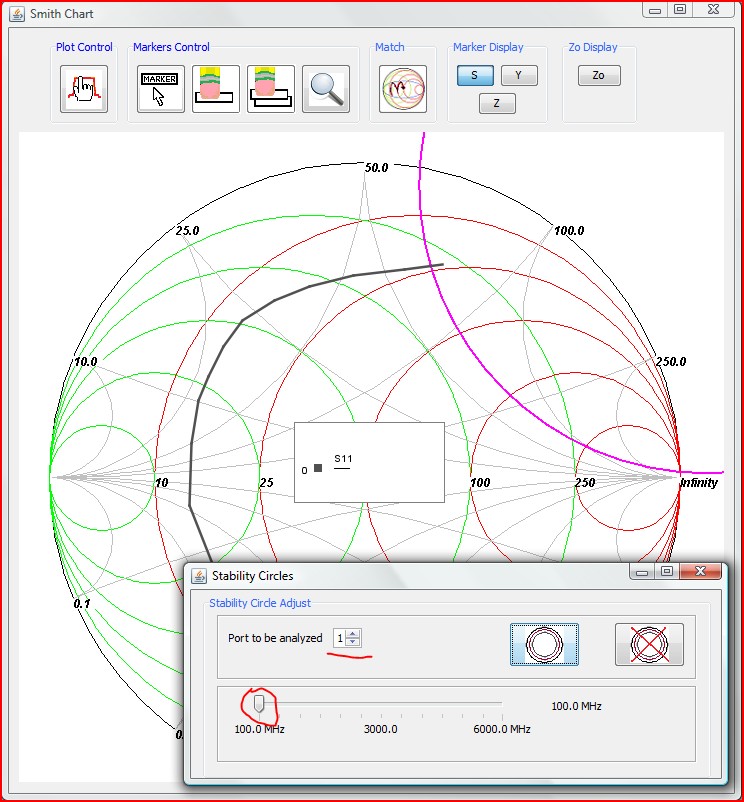
Clicking on this icon will pop up the Smith Chart window, a noise circle window (if noise data exists), and a Stability circle window. Sliding the stability window slider will plot the stability circle at the frequency indicated. Also changing the Port to be analyzed spinner will switch to the stability analysis relative to the displayed port number.